SmartMaps
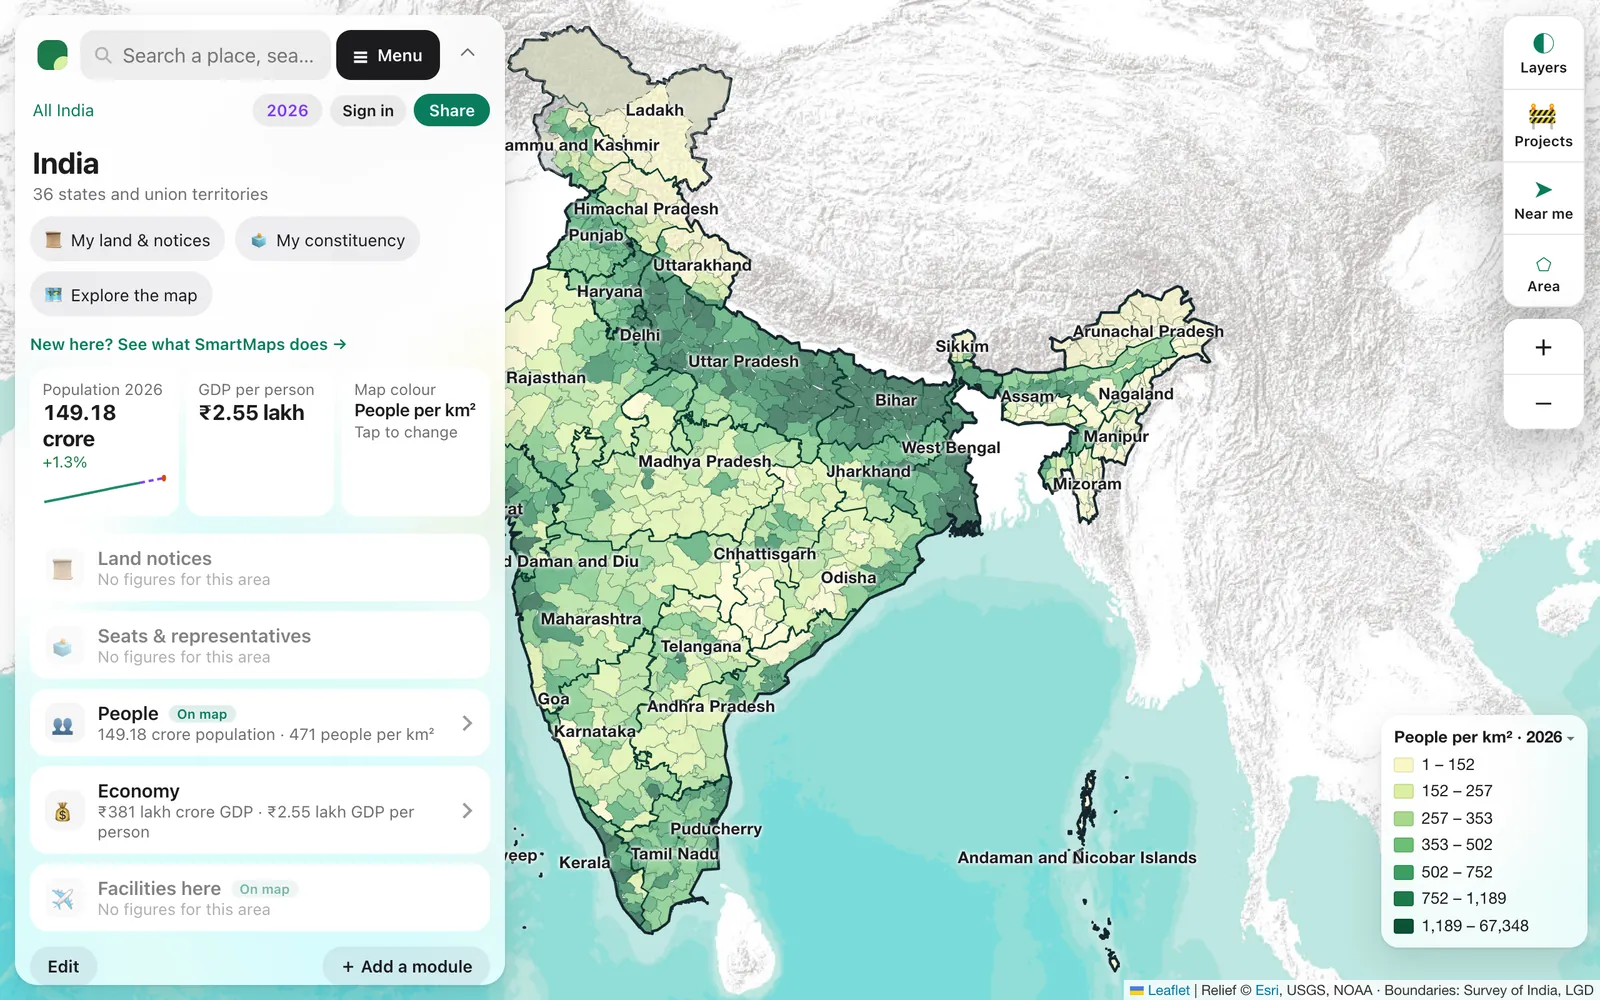
A map of India in numbers. Pick any state, district or constituency, or draw your own area, and see its people, economy, representatives, land notices and infrastructure from 2011 to today, with every figure labelled official or estimated.
The Problem
Numbers about a place in India are scattered across dozens of official sources, each with its own boundaries, years and formats, and most stop at the district. Families keeping an eye on land back home, lawyers tracking acquisition notices, journalists and campaign teams all end up stitching PDFs and spreadsheets together by hand.
What It Does
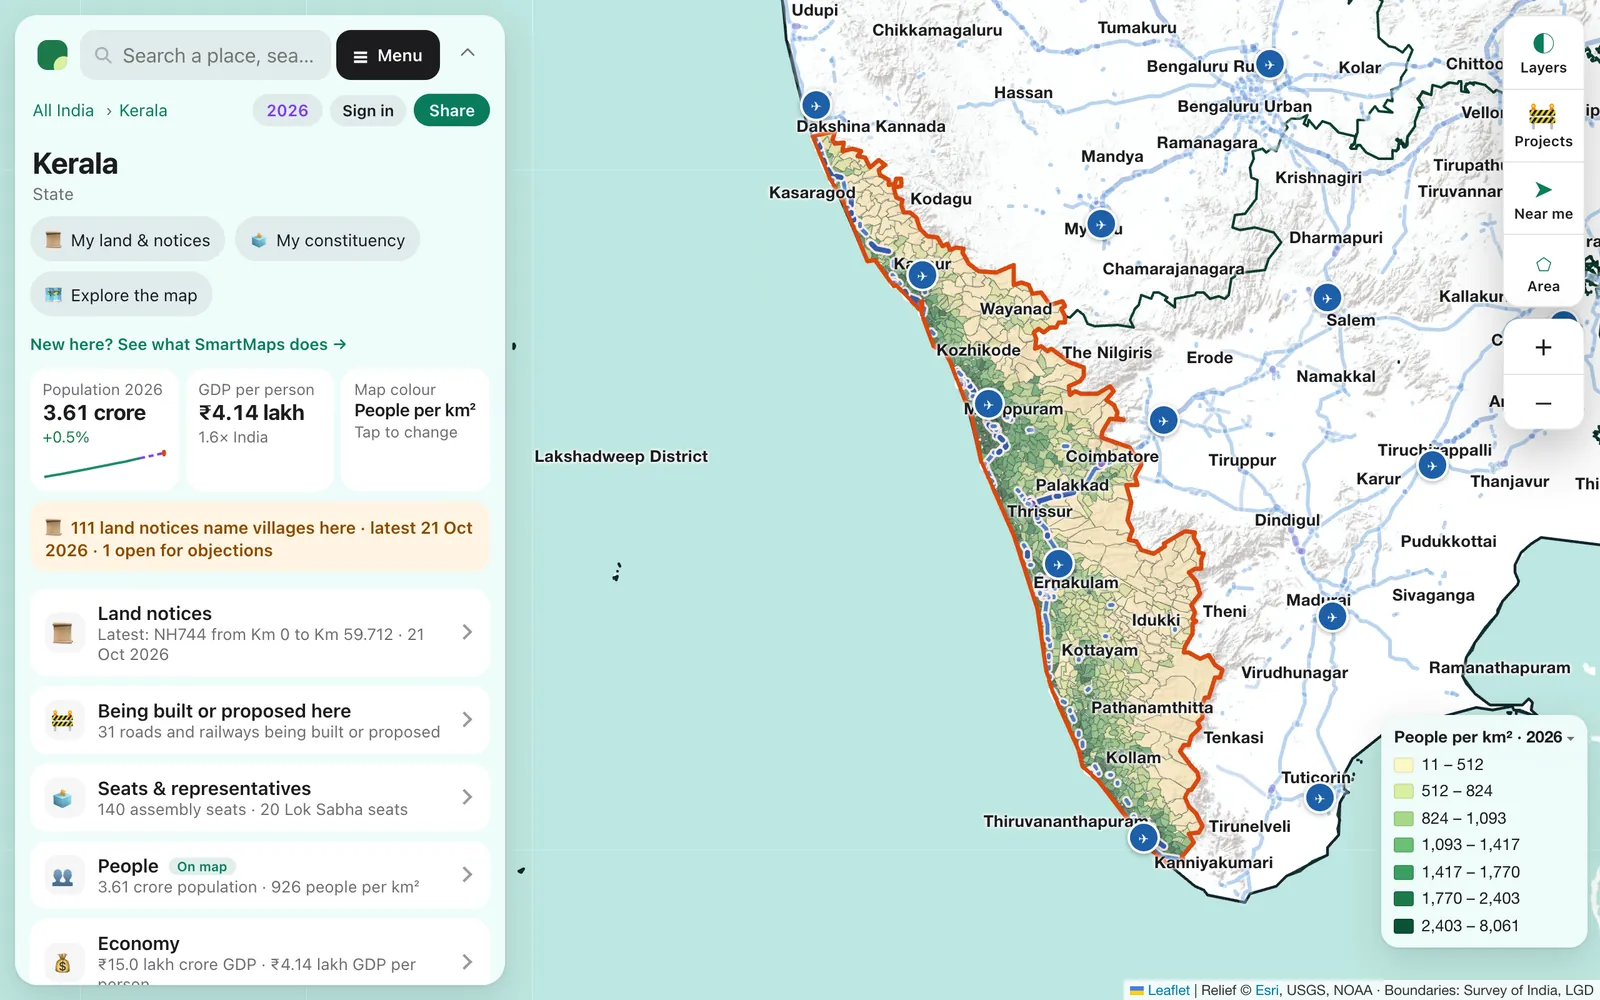
- Find any place by name or by tapping the map, from all of India down to every local body and village in Kerala. A short summary comes first; every figure is a tap away.
- Check land notices: whether a Gazette of India acquisition notice names your village, when, and whether objections are still open, with the notice itself.
- Know your seats: your assembly and Lok Sabha constituencies, their members, and the people, economy and services inside them.
- See change over time: play the years from 2011 to 2026 for population, GDP, vehicles and more, with official years and projections told apart.
- Draw your own area: a circle around a home or a shape around a project, counted from a grid of roughly 0.85 km² cells that covers the country.
- Follow projects: every road and railway being built or proposed, with how far along it is.
- Make it your own: 17 modules, every figure sourced, to choose, reorder and save. Made for phones, with dark mode and a Malayalam option.
By the Numbers
36States and union territories
772Districts mapped
3,972Assembly seats mapped, each with its member
543Lok Sabha seats
10,800+Gazette land notices read
2011 → 2026Every year, official where published
How It's Built
- A Python data pipeline over official sources: Census 2011, the Sample Registration System, MoSPI national and state accounts, Election Commission results, the VAHAN vehicle dashboard, UDISE+, NFHS, and the Gazette of India, read daily.
- Where nobody publishes a figure for a place, the atlas estimates it with methods tested against real counts, and says so under the figure.
- Every figure carries its source, method and a plain label: official, official projection, statistical estimate, pro-rated, modelled, as mapped or projected.
- A static site on Firebase Hosting with a Cloudflare Worker at the edge. A scheduled job rebuilds the data and redeploys every morning.
- Sign-in and paid plans run on a Cloudflare Worker API with D1, and payments go through Razorpay.
- Kerala and India began as two sites and now live together at smartmaps.in.
- It started from moneymap, an MIT-licensed open-source atlas, and grew from a Kerala-only map into all of India.
Key Decisions
- Answer first, detail on demand: a place opens to a short summary, and every figure is one tap from its source and method.
- Honest labels over false precision: estimates are shown where they help, but never passed off as official counts.
- Free to look, pay for the work around it: anyone can look up any place with no sign-in. Supporter (₹100 a month) and Pro (₹150 a month) add more modules, every figure for areas you draw, survey numbers, exports and reports.
- Depth on one state, then breadth: Kerala proved the model down to the village, in two languages, before the atlas went national.
Tech Stack
Python
JavaScript
Leaflet
Firebase Hosting
Cloudflare Workers
Cloudflare D1
Razorpay
Google Analytics 4